Debugging in Clojure
Whenever I speak to other Clojure developers, whether they’re seasoned pros or brand new to the language, one question that always comes up is “how do you debug your code?”. Most of us have heard the rhetoric around REPL driven development - “develop your program interactively in the REPL, debugging as you go!”. This sounds straightforward, but it’s often not quite that easy in practice. Say you’re writing a REST API using Compojure, and you notice one of your endpoints is returning an incorrect response. How do you go about debugging it? In this case it’s not as easy as “construct a map in the repl, pass it to your function, and see if the output is what you expect”. You may not know what the request map looks like, and mutable state also gets in the way - things like database connections, Kafka consumers, and HTTP servers. In this guide, I’ll detail my personal approach debugging in situations like this.
Spyscope
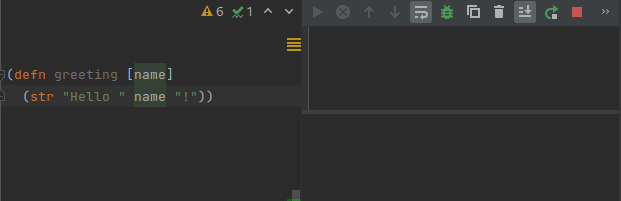
When I find a bug, often the first thing I do is good ol' fashioned println debugging. It may be primitive, but it’s often the quickest way to diagnose the problem! In other languages, it can be a bit awkward trying to shoehorn console.log statements into your code. Luckily, Clojure’s reader tags come in handy here. I’m a big fan of the spyscope
library, which exploits reader tags to full effect. It’s dead simple - once you’ve installed it as per the readme, just put #spy/p in front of the form you want to print out. It’s my go-to library for easily pretty-printing values to the REPL. When that code is executed, it’ll print the result of the form to the REPL, with nice colours to boot! This is great for quickly seeing what a form evaluates to, which is often all you need to diagnose the problem.
Scope-capture
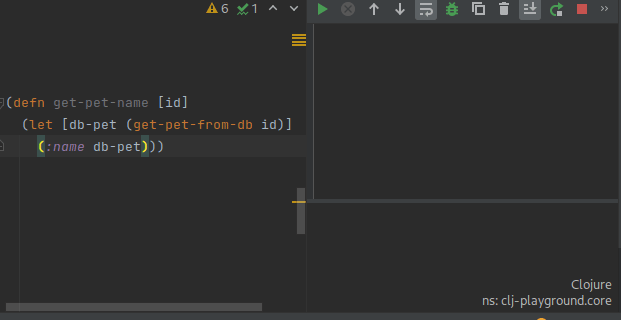
For cases when you need to debug a piece of code more thoroughly, the scope-capture
library is indispensable. It allows you to capture the local environment whenever a certain form is evaluated, and then re-create this environment in the REPL. This allows you to play around in the REPL as if you’d stopped the program at the point when the form was evaluated. This works really well with Stuart Halloway’s “divide and conquer”
approach to debugging. To set it up, just follow the guide in the readme
, then wrap the form you want to debug in the sc.api/spy macro. The next time the form is evaluated, you’ll see a message like SPY [1 -1] ... in your REPL. Now you can run (sc.api/defsc 1) in the REPL to recreate the captured environment. You can then evaluate forms within the spy, and see what the result would have been.
Dealing with let
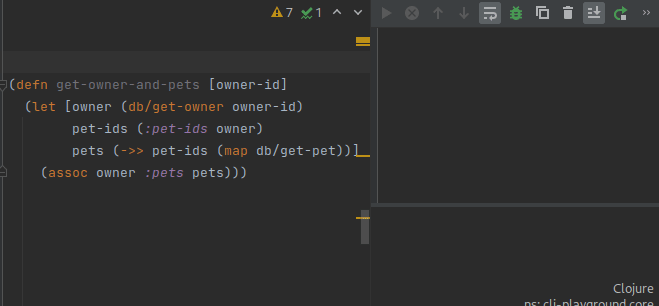
One debugging trick I’ve found very useful is to set up a command in your editor for def‘ing let bindings. This helps both when debugging pure functions, and using the scope-capture approach detailed above. Let’s say you have a function like this:
(defn get-owner-and-pets [owner-id]
  (let [owner (db/get-owner owner-id)
        pet-ids (:pet-ids owner)
        pets (->> pet-ids (map db/get-pet))]
    (assoc owner :pets pets)))
Imagine it’s not working as expected. One approach to debugging it would be to def the owner-id in your REPL and then evaluate each of the let bindings in turn. You would run (def owner-id 1234), then evaluate the let bindings one-by-one into your REPL, like (def owner (db/get-owner owner-id)). This can be a bit laborious when you have a big let binding, and I’ve found setting up a shortcut in your editor is well worth the effort. If you’re using IntelliJ and Cursive, you can add the following as a custom REPL command
:
(def ~selection)
Now you can def let bindings in your REPL by highlighting each binding in turn, and running your custom command.
Note that this doesn’t support let bindings containing destructurings, but it does give you a nice clear command for your REPL history. If you’d prefer a more complex command that handles destructurings, as well as allowing you to def multiple bindings at once, use this command
instead.
Other Tools
There are other some tools that I’ve played around with, but personally found I don’t use heavily. REBL
, Reveal
, and Portal
are graphical tools for viewing Clojure data structures. They’re a great idea, but to be honest I tried out REBL and found I didn’t use it much in practice. In the course of researching for this blog post I came across Debux
, a library which provides some nice debugging utilities. I haven’t had a chance to properly evaluate it yet, but it looks like a very helpful library. If you’re using Cursive, you can also use Intellij’s built-in debugger. This may be useful in some circumstances, but in general I’ve found that using scope-capture is easier and more effective. The debugger pauses the thread which is executing the code, which can often cause havok with other threads (in a Kafka Streams topology for example).
Summary
I hope that gives you a few useful tips for debugging Clojure code. If you want to read more on the subject, there are many more excellent blog posts on the subject - I’ve linked to some below. Thanks for reading!
- https://www.cognitect.com/blog/2017/6/5/repl-debugging-no-stacktrace-required
- http://www.futurile.net/2020/05/16/clojure-observability-and-debugging-tools/
- https://medium.com/appsflyer/repl-based-debugging-in-clojure-278fb468a33
- https://eli.thegreenplace.net/2017/notes-on-debugging-clojure-code/
- https://practical.li/spacemacs/debug-clojure/